San Diego Urban Heat Island
Links
Project Details
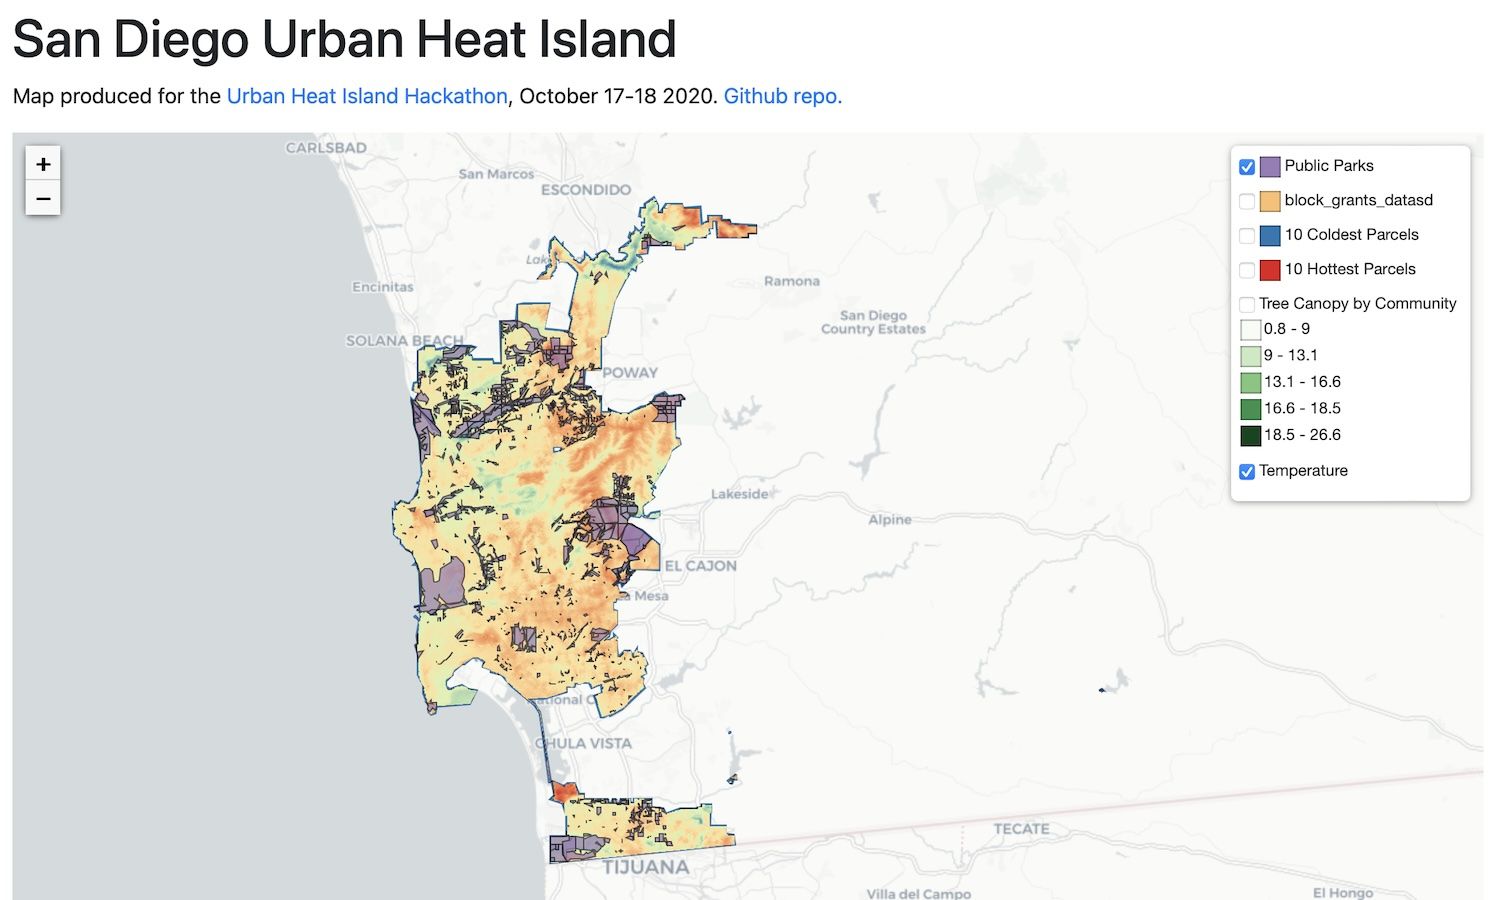
Map produced for the Urban Heat Island Hackathon, October 17-18 2020.
Our team downloaded temperature data from NASA ECOSTRESS for San Diego. We processed the GEOTIFF using QGIS. And we did a comparison of temperature, tree canopy, public parks, and low and moderate income areas. We exported the map as a web map.
Data Sources
Tech Stack
- QGIS
- Leaflet
- Previous: Introduction to R and GBIF